Energy Supplier Dashboard - Design Case Study
The project
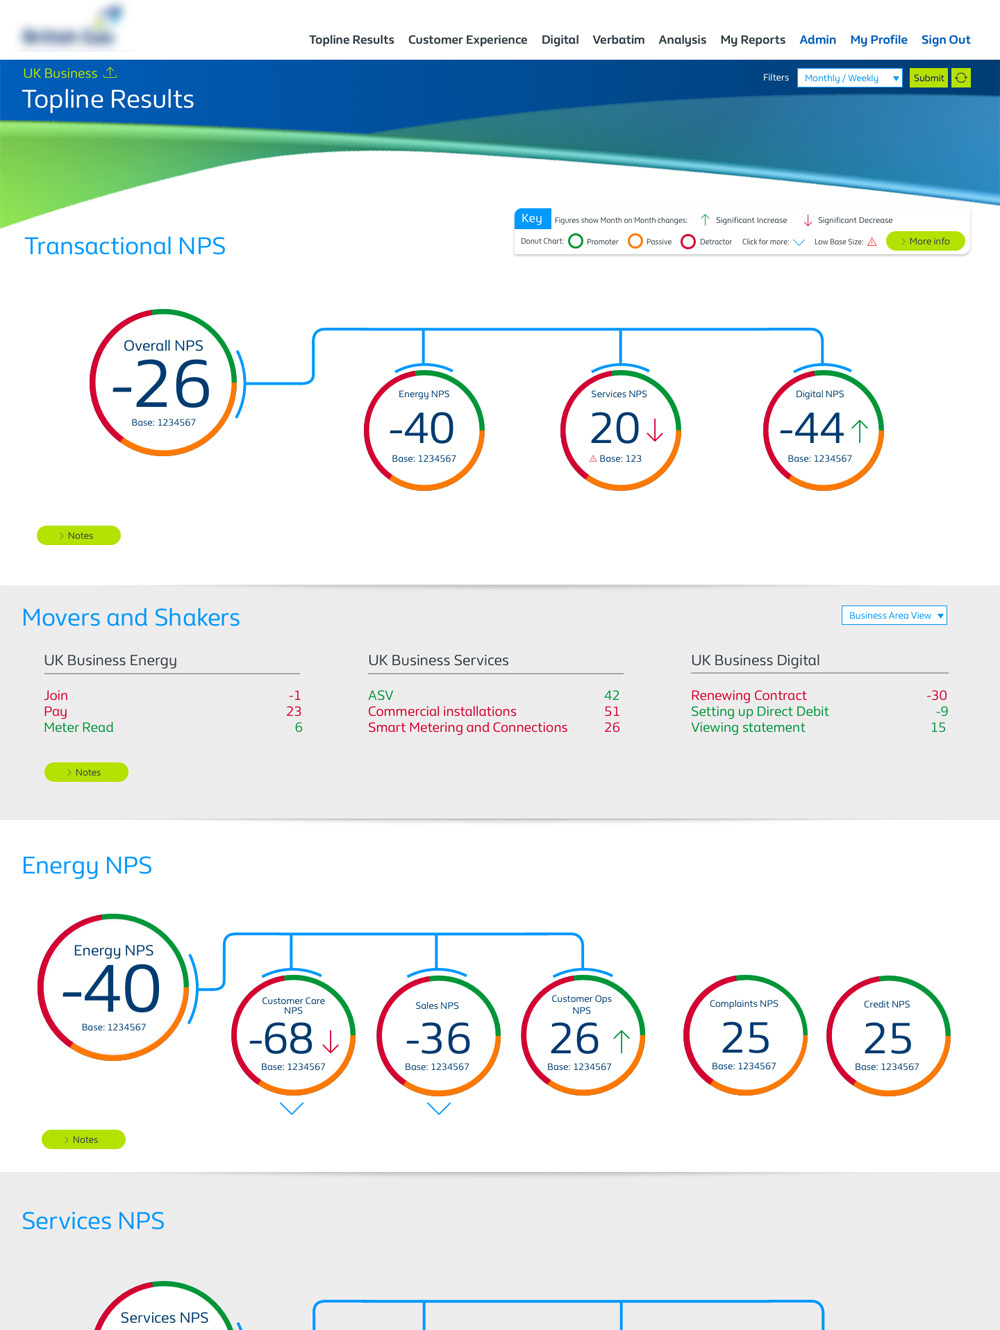
I worked with this well-known national energy supplier to create the UI and UX design of emails, a survey and the implementation of KPMG's Insight Cloud, a web-based intranet Customer Experience (CX) survey analysis dashboard product. This dashboard was used by many dozens of users in the business a day, to improve their customer service. The data feeding the dashboard product was gathered by thousands of targeted emails, inviting customers to fill in a customer satisfaction survey. I designed the email and survey visual design.
The brand name is hidden in the screen shots to provide some client confidentiality, and dummy data is used to protect client data.
My role
I was the senior UI and UX designer throughout the project, leading on all UX design decisions. I created sketches, wireframes, mock-ups, prototypes and crafted all of the HTML, CSS and the front-end user interface elements. I ensured that the dashboard and survey was fully mobile responsive, met user needs, applied the brand correctly, was accessible and easy to use. I worked alongside account engagement managers, project managers, data and insight analysts, product managers and product software developers to deliver the email, survey and dashboard product designs.
Discovery phase and researching the problem
The client reporting on customer satisfaction was split by two business divisions: the supply of energy to domestic customers and to business customers. Before our involvement, disparate customer service reporting tools were manually collated and were time consuming and slow to create. A single dashboard solution was required.
Client scoping
We had a few project meetings and calls with the client, with our project management and data insight teams, to determine what their business aims were in using the dashboard and what questionnaire questions they most required.
Internal scoping
Internal meetings determined the basis of what was in scope.
Defining the user and client requirements
We started work on a schematic document in Excel with all the survey questionnaire answer types mapped to the types of charts on the dashboard. This helped us structure the pages of the dashboard for user and business need.
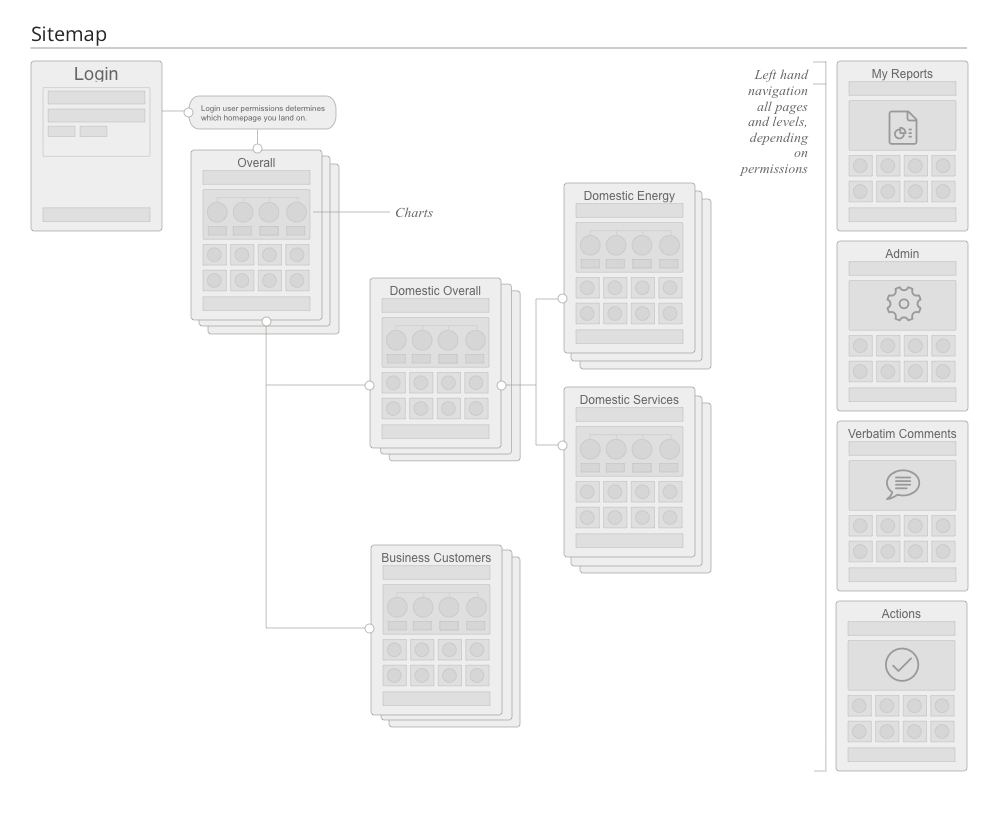
User journey and user flow
In client meetings we held white board and flip chart sketching sessions, designing the layout of the charts and survey data that each user group could see, and the information architecture. This led to a sitemap and basic user flow.
Research
We analysed the departmental divisions between the business and domestic customer service and marketing teams in the company.
User groups and personas
GOALS:
- High level feedback from business customer accounts.
FRUSTRATIONS:
- Needs rapid and regular access to data reporting.
DASHBOARD USAGE:
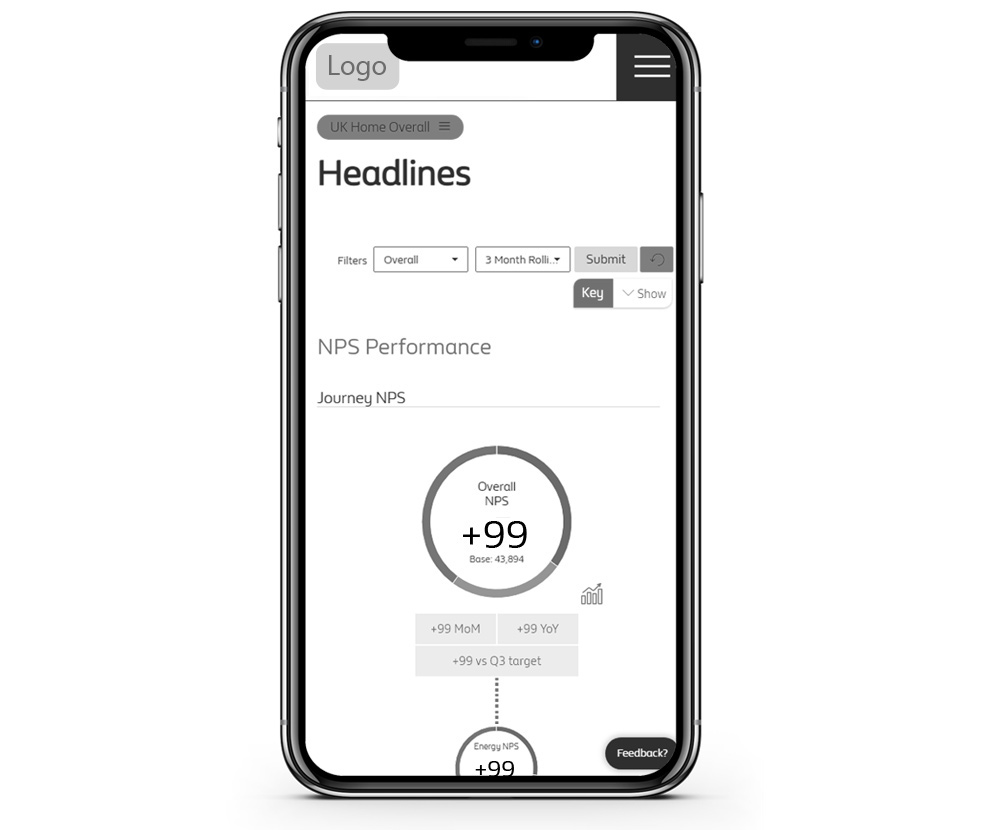
- In office but could be on the move to clients. Most likely to be mobile users.
GOALS:
- Understand team performance against targets.
- Create actions from the feedback for the team.
FRUSTRATIONS:
- Need close to real time feedback from customers.
DASHBOARD USAGE:
- In office for top-level reporting.
GOALS:
- To get regular feedback in how to improve the brand perception.
FRUSTRATIONS:
- Difficulty in seeing reputation problems.
DASHBOARD USAGE:
- In office at desktop PC.
GOALS:
- Strategic overview of top-level customer service feedback.
- View the data, themes and comments to identify regular customer problems.
FRUSTRATIONS:
- Reporting in Excel slow. Needs easy to use top-line reporting.
DASHBOARD USAGE:
- In office and using a tablet occasionally.
GOALS:
- Monitor team’s performance against targets.
- Easily spot where team’s performance was below that of other teams.
FRUSTRATIONS:
- Reporting in Excel slow. Needs easy to use top line reporting.
DASHBOARD USAGE:
- In office for top level reporting.
GOALS:
- Identify brand perception problems and where brand suffers from a bad reputation.
- Make actions to improve low scoring areas.
FRUSTRATIONS:
- Domestic customer retention requires a system of quick feedback.
DASHBOARD USAGE:
- In office on a PC.
Design development of potential solutions
Here we refined our ideas based on what we had discovered of the client requirements.
Ideation – brainstorming
Both with the client and internally we refined our flipchart or whiteboard sessions and determined the structure of the dashboard divided by client department and user divisions with the key chart types.
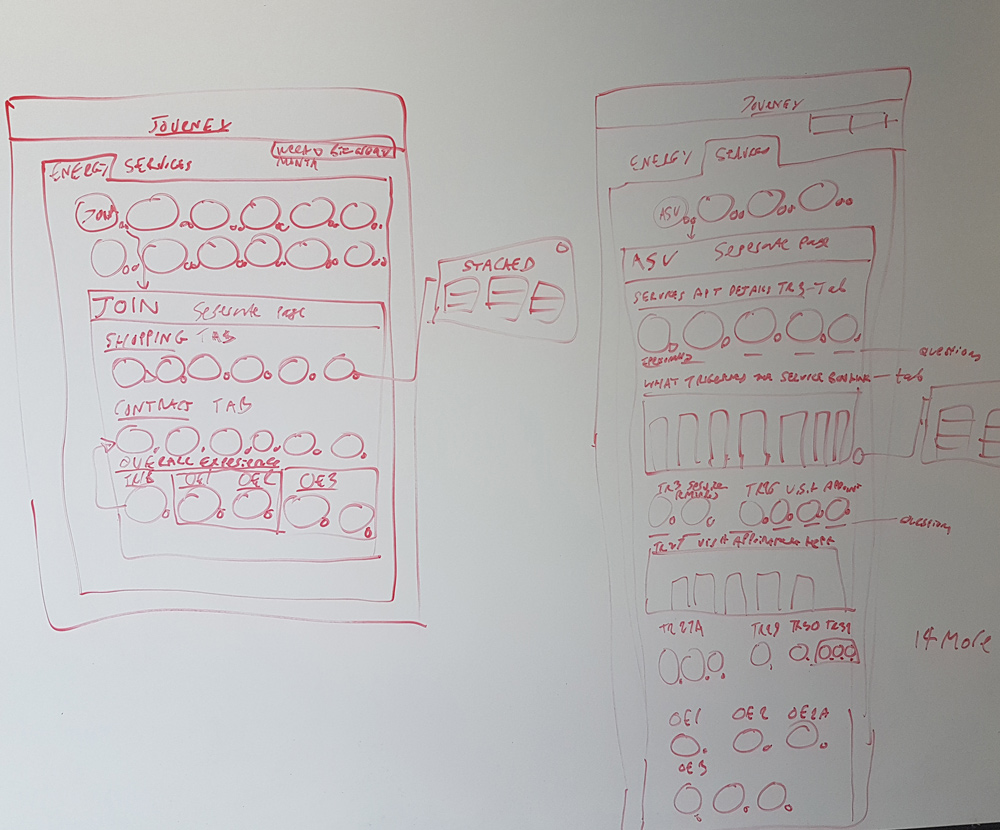
Sketching, wireframes and improvements based on user feedback
I began to sketch the layout, with a better idea of structure and content, in my sketchbook. Low and mid fidelity designs were shared with the client for rapid user feedback, iterating the designs and improving them.
Design delivery
I created a variety of design assets for this project:
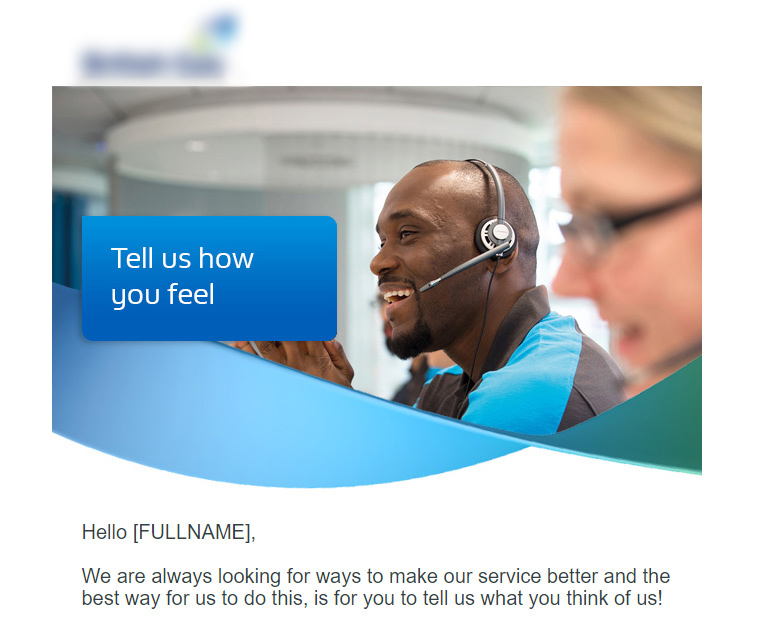
Survey invite email design
- Designs in Sketch.
- Imagery in Photoshop CC.
- Prototypes in Invision.
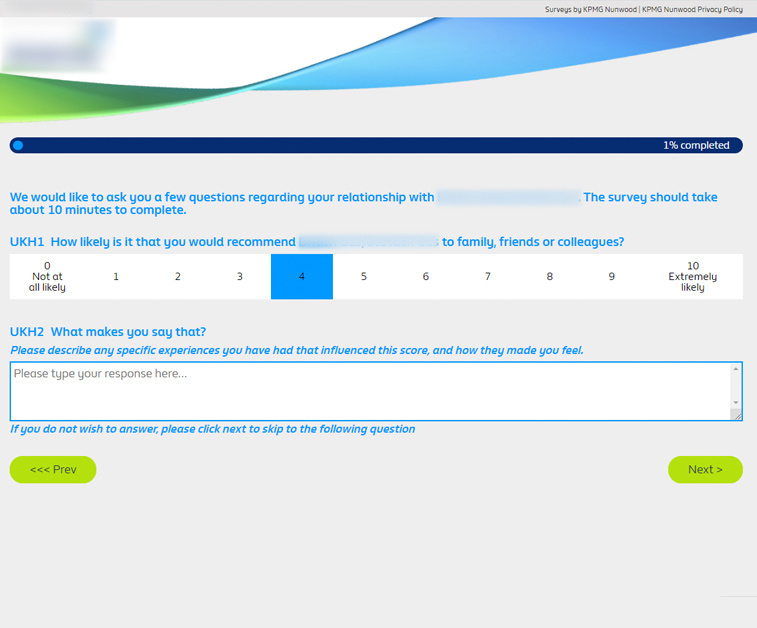
Survey designs
- Designs in Sketch.
- Prototypes in Invision.
- Some mock-ups in HTML.
Low fidelity dashboard wireframes
- Designs in Sketch.
- Prototypes in Invision.
- Tested with client users.
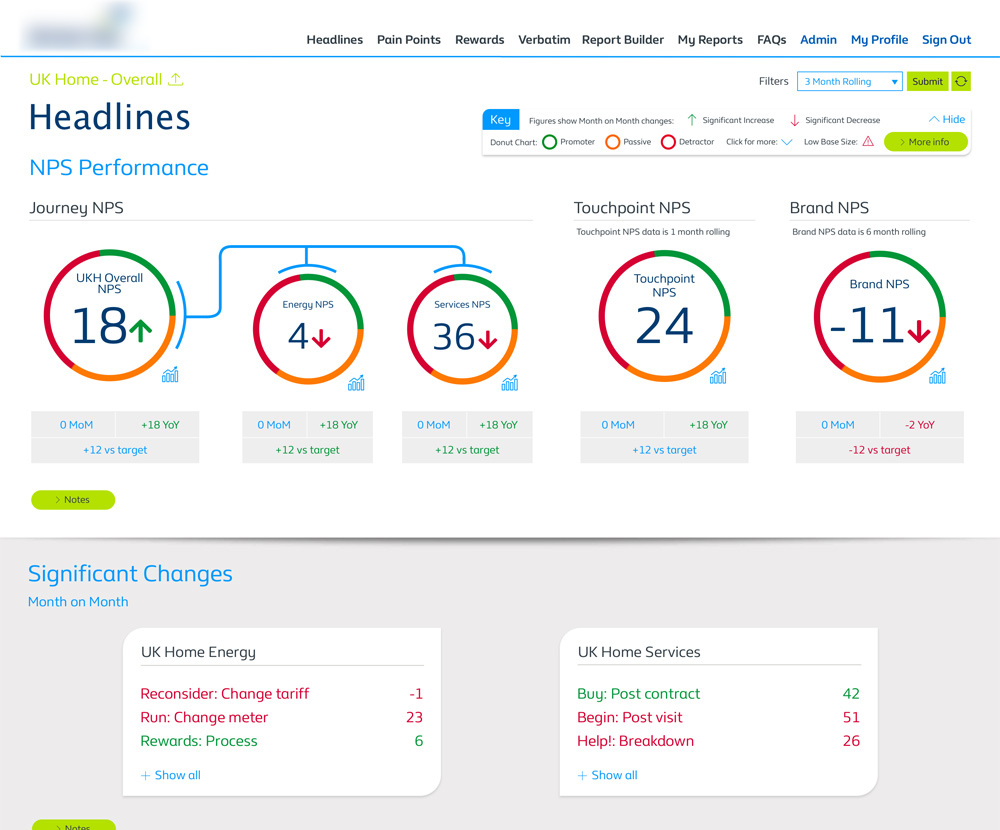
Final designs
- Fully branded designs in Sketch.
- Prototypes in Invision.
- Tested with client users.
Build phase
There were several build phases rolling out the main components of the fully functional dashboard product to the client.
Email build
- CSS, images and fonts supplied to developers for the email software.
Survey build
- CSS, images and fonts supplied to developers for the survey software.
Dashboard build
- Completed in Agile sprints, with coding best practice.
- I worked alongside Implementation Team colleagues who provided charts and data to be styled.
- I created HTML, LESS, CSS, images, fonts and front-end user interface elements and added them to the product using GIT.
- I styled Highcharts JS plugin for Dashboard charts.
- I created the dashboard as a fully responsive, mobile web delivered piece of software.
Support phase
The Dashboard was launched in an agile way with releases on a UAT test site for the Client to view with a variety of bug testing and refinement stages.
User feedback and iteration
- Accessibility, usability, UAT testing and QA.
- Stakeholder feedback sessions.
- Observations of users' use of the dashboard.
User guide
I created user guides in Adobe InDesign CC to aid in training and to support the product.
Results and reflections
The business was able to improve customer satisfaction through the dashboard product and target problem areas. This improved customer retention for the client.